
First of all, allow me to apologize for a solid month of failed updates. The world of coaching my son’s football team and bugbashing caused me to want to spend my time at home, asleep, rather than writing about my various misadventures in F#.
To update on the application rewrite, upcoming tax legislation has my firm in quite a tizzy, and is requiring an all-hands on deck approach for the next few weeks. Assuming the bill passes, we may be changing a lot of software, quite quickly, and absolutely none of that has anything to do with an old poorly-written report. The upcoming business need will be drastic, and preparing for that change is important to do.
That said, let’s play around a bit in F#!
I was watching an old episode of Futurama, when a question popped into my mind. If Fry left a bank account with $0.93 in it, at 2.25% interest, would he actually be sitting on a cool $4.3 billion after being frozen for 1000 years? Time to find out!
This file contains hidden or bidirectional Unicode text that may be interpreted or compiled differently than what appears below. To review, open the file in an editor that reveals hidden Unicode characters.
Learn more about bidirectional Unicode characters
| type Compounding = | |
| | TimesPerYear of float | |
| | Constant | |
| type InterestCalculationOptions = { | |
| Compounding : Compounding | |
| Rate : float | |
| Principal : float | |
| TermInYears : float | |
| } | |
| let compound options = | |
| let core r e = | |
| options.Principal * (r ** e) | |
| match options.Compounding with | |
| | Constant -> core System.Math.E (options.Rate * options.TermInYears) | |
| | TimesPerYear f -> let rate = options.Rate / f | |
| core (1.0 + rate) (f * options.TermInYears) | |
| let fry = compound { Compounding = TimesPerYear 1.0 | |
| Rate = 0.0225 | |
| Principal = 0.93 | |
| TermInYears = 1000.0 } |
val fry : float = 4283508450.0
Looks like the math works… but man oh man does it take a while to get there. Using FSharp Charting and iterating over each year…
let fryOverTime = [ 1.0 .. 1000.0 ]
                    |> List.map (fun t -> compound { Compounding = TimesPerYear 1.0
                                                     Rate = 0.0225
                                                     Principal = 0.93
                                                     TermInYears = t }  )

Chart.Line(fryOverTime
            , Name="Balance over Years"
            , XTitle = "Years"
            , YTitle = "Balance in Dollars")
       .WithXAxis(Min=0.0, Max=1000.0)
// because it's almost impossible to see any change until year 650 or so...
Chart.Line(fryOverTime
            , Name="Balance over Years"
            , XTitle = "Years"
            , YTitle = "Balance in Dollars")
       .WithXAxis(Min=0.0, Max=1000.0)
       .WithYAxis(Log = true)
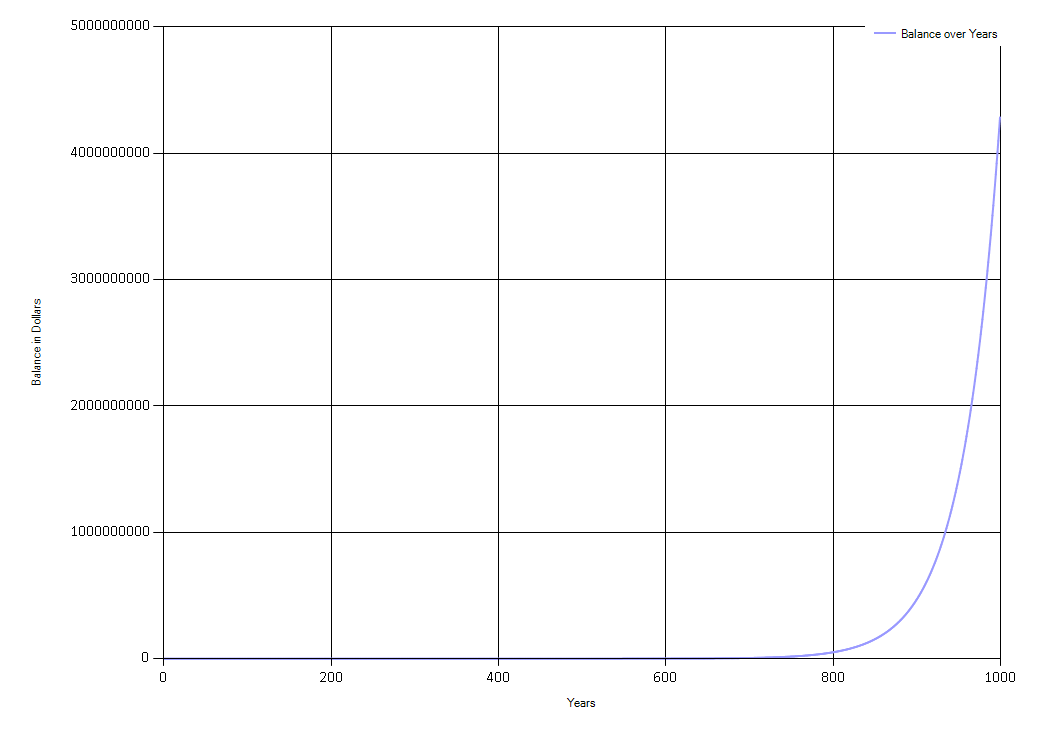
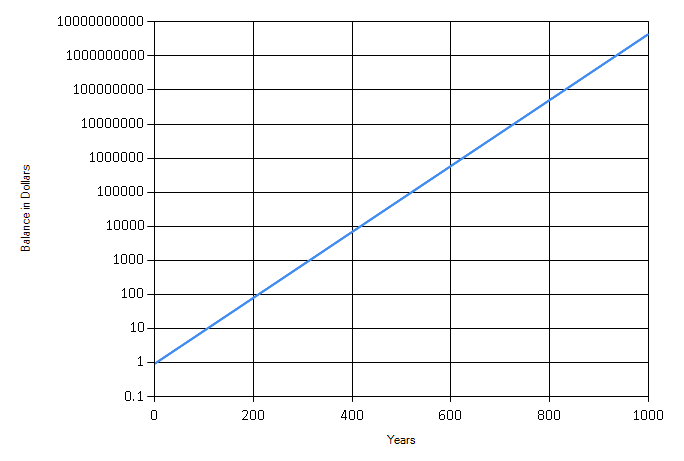 It looks like Fry’s bank account doesn’t get interesting until about 300 years or so. Still, compound interest is a wonder, despite whether or not Albert Einstein said so.
One thought on “A Fishful of Dollars”